📊 Candlestick Patterns Every Trader Should Know
📘 Simple Beginner’s Guide to Stock Market Charts
Candlestick patterns are one of the most popular tools used in technical analysis. They help traders understand market movement, buying pressure, and selling pressure.
Many traders use candlestick charts to study possible market trends and price behavior.
This guide explains important candlestick patterns in simple English for beginners.
🕯️ What Is a Candlestick?
A candlestick shows the price movement of a stock during a specific time period.
Each candle shows:
- 📈 Opening Price
- 📉 Closing Price
- 🔺 Highest Price
- 🔻 Lowest Price
🔵 Types of Candles
📈 Bullish Candle
A bullish candle forms when the closing price is higher than the opening price.
✅ What It May Mean
- Buying strength in the market
📉 Bearish Candle
A bearish candle forms when the closing price is lower than the opening price.
⚠️ What It May Mean
- Selling pressure in the market
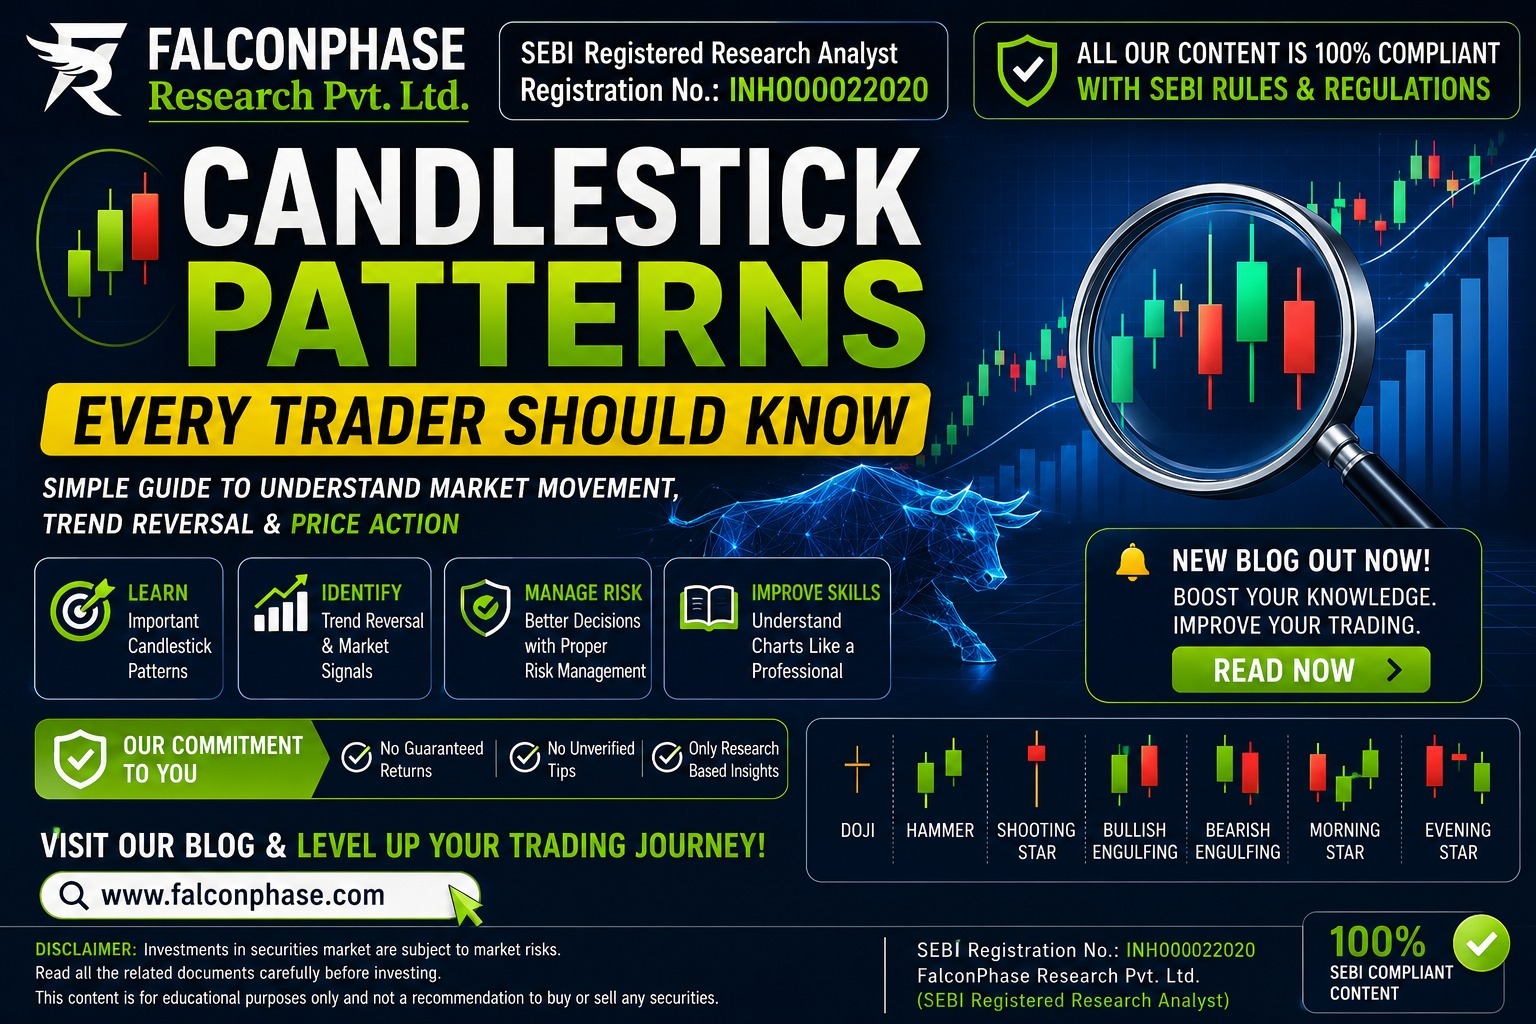
⭐ Important Candlestick Patterns Every Trader Should Know
1️⃣ Doji Pattern
The Doji candle forms when the opening and closing prices are almost equal.
✅ What It May Mean
- Market confusion
- Buyers and sellers are balanced
- Possible trend reversal
📌 Traders often watch this pattern near important market levels.
2️⃣ Hammer Pattern
The Hammer pattern usually appears after the market falls.
🔍 Identification
- Small body
- Long lower shadow
✅ What It May Mean
This pattern may show that buyers are trying to push prices higher after selling pressure.
3️⃣ Shooting Star Pattern
The Shooting Star pattern usually appears after the market rises.
🔍 Identification
- Small body
- Long upper shadow
⚠️ What It May Mean
This pattern may indicate weakness in buying momentum.
4️⃣ Bullish Engulfing Pattern
This pattern forms when a large bullish candle completely covers the previous bearish candle.
✅ What It May Mean
- Strong buying interest
- Possible upward movement
📌 Many traders use this pattern to study possible bullish trends.
5️⃣ Bearish Engulfing Pattern
This pattern forms when a large bearish candle completely covers the previous bullish candle.
⚠️ What It May Mean
- Strong selling pressure
- Possible downward movement
6️⃣ Morning Star Pattern
The Morning Star is a popular bullish reversal pattern.
It usually appears after a market downtrend.
🔍 Structure
- Bearish candle
- Small indecisive candle
- Strong bullish candle
✅ What It May Mean
This pattern may show that selling pressure is reducing and buyers are gaining strength.
📌 Some traders consider it a possible sign of upward market movement.
7️⃣ Evening Star Pattern
The Evening Star pattern is opposite to the Morning Star pattern.
It usually appears after a market uptrend.
🔍 Structure
- Bullish candle
- Small indecisive candle
- Strong bearish candle
⚠️ What It May Mean
This pattern may indicate weakening buying momentum and possible selling pressure in the market.
📌 Why Candlestick Patterns Are Important
Candlestick patterns help traders:
- 📊 Understand market behavior
- 📈 Study price movement
- 🔄 Identify possible trend changes
- 🧠 Improve chart analysis skills
Many traders combine candlestick patterns with:
- Support and resistance
- Volume analysis
- Risk management
💡 Important Tips for Beginners
🛡️ Always Use Risk Management
Risk management is important while participating in the market.
🚫 Do Not Trade Emotionally
Fear and greed can affect trading decisions.
📚 Learn Before Trading
Education and practice are important before making market decisions.
⚠️ Avoid Depending on One Pattern
No candlestick pattern guarantees profit or market direction.
❌ Common Mistakes Traders Make
- Trading without proper research
- Ignoring market trends
- Taking too many trades
- Not using stop loss
- Making emotional decisions
❓ Frequently Asked Questions (FAQ)
Are candlestick patterns useful for beginners?
✅ Yes, candlestick patterns help beginners understand market charts in a simple way.
Can candlestick patterns predict the market perfectly?
❌ No. Candlestick patterns only help in analysis and do not guarantee future market movement.
Which candlestick pattern is easy for beginners?
📌 Doji and Hammer patterns are commonly considered easy for beginners to understand.
Can candlestick patterns be used in intraday trading?
✅ Many traders use candlestick patterns in intraday trading along with other technical analysis tools.
🏁 Conclusion
Candlestick patterns are useful tools in technical analysis. Patterns like Doji, Hammer, Shooting Star, Engulfing, Morning Star, and Evening Star help traders study market behavior and possible trend changes.
However, candlestick patterns should be used only for educational and analytical purposes. Traders should always use proper research, discipline, and risk management before making any trading or investment decisions.
⚠️ Disclaimer
This article is intended only for educational and informational purposes. It should not be considered investment advice, trading advice, recommendation, or guarantee of profits in the stock market. Investments and trading in securities markets are subject to market risks. Readers should conduct their own research before making financial decisions.
FalconPhase Research Pvt. Ltd.
SEBI Registration No: INH000022020